
Understanding network traffic is how we identify opportunities and proactively address inefficiencies. But understanding requires oversight, and oversight requires monitoring. As our networks grow – and the amount of traffic rises – you’re tasked with seeing what is being sent and received across not just nations, but continents. This requires satellite links, and software able to make use of the raw data generated.
More information requires better reporting. The only way we’re able to optimize networks is by understanding how they’re used: the patterns, behaviours and participants. This allows us to stay ahead of slow-downs or network crashes, or to diagnose issues efficiently. Root causes aren’t always obvious; often times, it’s the tiny details that go amiss which send networks thrashing.

Satellite Links Are Necessary, But Costly
Our networks are constantly growing, and we need a way to connect globally disparate participants. The problem, however, is that modern networks often rely upon satellite links. Satellite links are costly – with a high per-megabyte cost – but necessary. For network managers, visibility for purposes of optimisation has never been more important. Every megabyte and statistic counts.
How To Monitor Satellite-Link Network Traffic
Once we’ve reconciled with the need for satellite links, we’re left with learning how best to monitor their network traffic. The network devices used in satellite links generate metadata on either side of the link (raw data that is pinged between two geographically disparate locations). It’s essential that the metadata be accessible in a way that creates insight, and drives future optimizations. The most popular way to achieve this – to gather network information – is using NetFlow.
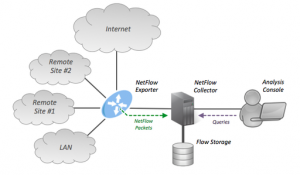 Enabling NetFlow on your network devices will set them to collect TCP/IP (Transport Control protocol/Internet Protocol) traffic statistics on specific network interfaces. Once NetFlow has gathered the relevant metadata in the form of statistics, it can then be analysed by specialised software (such software is known as a NetFlow collector).
As any network manager knows, statistics don’t do much for driving insights. To optimize, it’s necessary to monitor networks on a granular level: understanding the minute-by-minute, day-by-day, user-by-user landscape. So we have to make more out of metadata, and to have it compiled and reported in a way that reduces friction, increases efficiency and provides clear insight.
Get Started Using Scrutinizer by Plixer
When incidents occur, there’s not always time to deliberate the information you’re receiving; network managers need software capable of telling them precisely what’s happening in the moment, and to access that information later on to inform their decisions. When it comes to identifying the remote variables affecting network performance – and, ultimately, your users’ experiences – no other software can match the exactness and precision of Scrutinizer by Plixer.
Scrutinizer provides context and clarification to large quantities of raw data, helping network managers to understand the how, why, and when of network mishaps. Knowing how many users access your network from a certain country isn’t especially useful; knowing their behaviours and data habits correlated to their location and circumstance, however, is.
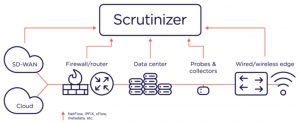
Scrutinizer correlates NetFlow, IPFIX, and metadata, and is able to map usernames with IP addresses. Complete network traffic data is monitorable within a single user interface, and visibility is provided across both the underlay and overlay.
Scalability isn’t just about the capacity and speed of the network; it’s also about how fast problems can be identified and addressed. Scrutinizer helps you arrive at the root cause of a problem more efficiently – bringing together the user, device, location, protocol, and application data for every conversation on the network – and improves problem diagnosis and optimization with comprehensive collation and visualization of data.
Try It Out
Seeing isn’t always believing, however, so we’re offering a 30-day trial of Scrutinizer to run on your network. Alternatively, we’d love to demonstrate its capabilities to you directly in a web session. For more information, or to arrange a demonstration, contact us today.