The challenge of network monitoring is driven not only by the rising quantity of data, but the disparateness of data. Networks must now traffic different types of data, encrypted and non-encrypted, sourced from a variety of network applications and services. To effectively monitor and analyse this data, data enrichment is essential: data is more than trafficked bytes. Using the correct tools, data becomes information-rich packets to fuel insight and analysis, and give clarity into behaviours and usage patterns across the entire network.
And there are few services that organisations use more than Microsoft 365: as instrumental to modern workplaces as swivel chairs and whiteboards. Knowing how much traffic Microsoft 365 is using is important because it’s almost certainly using a lot – and understanding precise usage statistics is essential to optimising network performance. It might not be Microsoft 365, however. It could be Adobe. The point is, there are a set of key applications that most modern organisations use a great deal, and having an accurate understanding of that traffic – where it’s coming from and at what frequency – is what makes optimisation possible.
Metadata is king
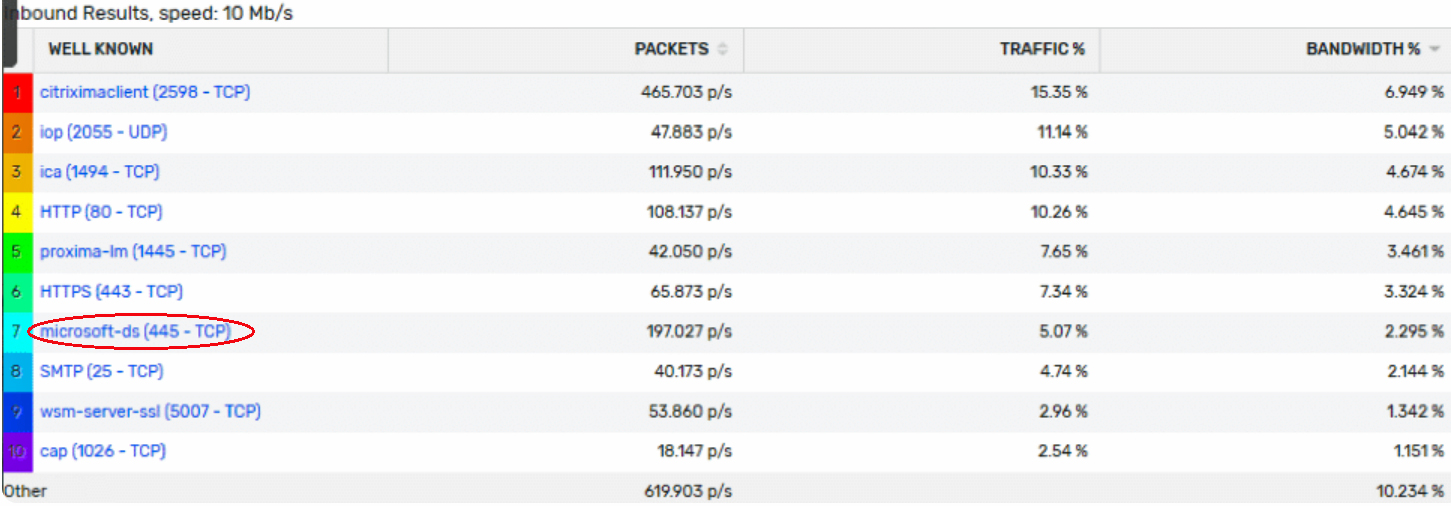
The more you see, the more you know. Understanding how Microsoft 365 data is trafficked helps to improve monitoring. Usually, metadata restricts visualisations to Layer 3 address space and Layer 4 transport. Vendors have begun to solve this by variants of metadata, such as IPFIX and Flexible Netflow, that offer more features. The likes of Cisco and Palo Alto, for example, include application ID in metadata exports, to correlate traffic to a more meaningful identifier.
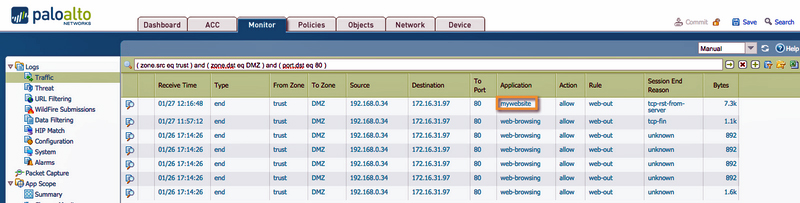
A look at Palo Alto Firewall tells us how this works. While we can find out what a specific port is used for if we examine IPs, the process is guaranteed to be time-consuming. But with Palo Alto application ID, ports are swapped out with a logical name, such as Applications. This is done on the device level, resulting in enriched data that make reports more useful and actionable, reduces the time to know if an application is causing a problem and helps inform network plans and strategies.
Going deeper
App ID is a very useful feature, but it requires having a certain network vendor – and you might need to push configuration changes to devices to enable the features.
Using the Scrutinizer API, a deeper dive into the data becomes possible. The data provided by Microsoft has everything necessary to name traffic within Scrutinizer itself. This level of data enrichment – the level in which more customizations and, through them, optimisations are made possible – makes interpreting data reports a lot easier.
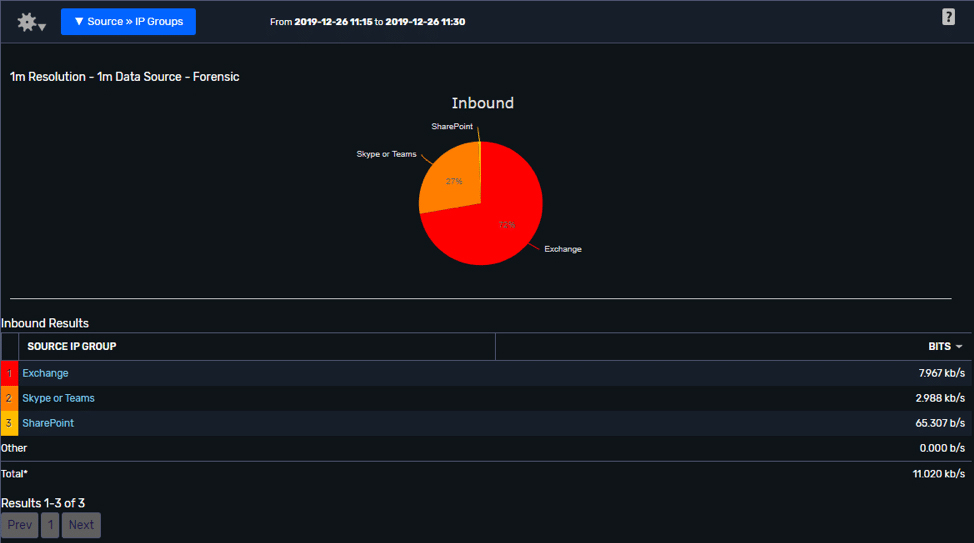
Scrutinizer’s IP groups feature also helps here, allowing for interactions between networks to be visualisations and, in turn, helping you maximise the benefits of collecting network metadata. Improving the grouping of IPs and the level of attribution provided by the solution (naming or otherwise) means that once specific application traffic is identified, it can be named and more easily reported on to inform optimisation decisions and improve problem resolution.
For more information about Plixer’s Scrutinizer network monitoring and analysis solution, or how to better understand and report on your network traffic, please contact us today.