
Welcome to a series of blogs written around the subject of measuring and monitoring Network Performance and Security.
Help! Why has my network gone slow again?
If you are a network administrator or security professional, you may be used to being asked such questions as:
- “Why is the network running slowly today?”
- “Has the internet just gone down?”
- “Is there something funny going on with our network?”.
Sometimes the answer can be obvious, perhaps a server has crashed, or a router has gone down. But at other times answering such seemingly simple questions can be surprisingly tricky. Particularly in large distributed networks and when you are busy with projects.
The answer: monitoring with NetFlow
One way to answer these questions and others is to have a way of monitoring the network and analysing the traffic running across it.
Any solution you buy will need to be able to compare what is happening now (when the questions are asked) with what happened yesterday. Or last week or last month so that you have a good baseline for comparison.
For that, you will need to be able to collect large data sets and be able to extract relevant information. It needs to be presented in an easy to visualise, highly configurable and graphical way that is meaningful and quick and easy to work with.
Then, you can start to see how the network is performing and who the busiest “talkers” on the network are now and in the past.
And you can start to see if those conversations are typical, or perhaps they are now becoming a bottleneck and overwhelming a network link.
Or verify if certain applications should be running at all.
And is that network traffic going between expected sources and destinations at the right times and in expected amounts?
Hackers will go to great lengths to disguise what they are doing on a network and so any software monitoring tool needs to be configurable for alerting. Crucially it needs to have detailed analysis capabilities and be able to keep a full record going back sufficiently in time for post-incident analysis.
Collecting Cisco TCP/IP traffic statistics with NetFlow
One of the most popular ways to achieve all of this to use a network information gathering system based upon CISCO NetFlow.
Back in the late 1990s, CISCO started developing NetFlow for their routers to improve performance. But it’s been used ever since for network device monitoring purposes. CISCO have incorporated NetFlow into an ever-expanding portfolio of their network devices and over time enhanced the NetFlow protocol itself. In fact, an international standard has now been developed called IPFIX which is based closely on the latest version 10 of NetFlow.
There are many non-CISCO vendors who now also support NetFlow. But the most universally supported alternative, even by CISCO, is something called sFlow. I will discuss sFlow in much greater detail in a subsequent blog article.
Enabling NetFlow on your network devices will set them to collect TCP/IP (Transport Control Protocol/Internet Protocol) traffic statistics on specific network interfaces. Once these statistics are collected, they are then exported as flows, to a NetFlow collector for analysis. A good NetFlow collector has software which will help analyse and visualise the flow data for you.
There are many different NetFlow collector vendors who provide network analysis software. In these blog articles, I will be concentrating on a very well regarded, advanced network analysis product called Scrutinizer made by Plixer.
Scrutinizer accepts up to 40,000 flows per second
In the right configuration, Scrutinizer can accept up to 40,000 flows per second from hundreds of network devices across a network.
With fast detailed security or performance-based reporting and dashboards, Scrutinizer supports all major network vendors and flow types, including CISCO NetFlow.
A sample Scrutinizer performance based dashboard:
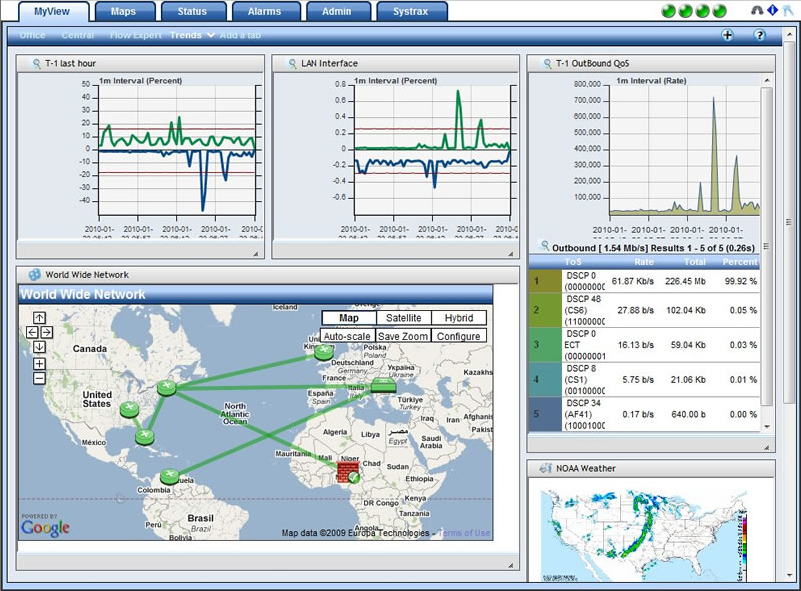
Scrutinizer network performance dashboard
So, with the correct implementation of NetFlow and a suitable NetFlow collector and analyser you can finally answer those questions that your users or boss keeps on asking you. And with the reporting and alerting functions built into a product like Scrutinizer you can even pro-actively fix them before they become a real problem.
What’s next
In the next blog I am going to look at the OSI model to make it easier to compare NetFlow with sFlow.
sFlow is a popular alternative way of looking at network performance but its quite different from NetFlow and you need to know why.
If you want to know more then please read my other blogs or contact us here at Info Stor . A member of our team will answer all your questions and provide you with free assistance in setting up a no obligation 30 day trial of Plixer Scrutinizer.
Read more in my series of blogs: