Most security solutions come paired with their own dashboard – and therein lies a problem. A series of dedicated dashboards will provide visibility, but it’ll be visibility with friction. Imagine that each department in your company is capable of producing an accurate and comprehensive report. It’s then down to you to derive lessons from these reports, to collate the data and create an overall view of your company.
This takes time. You’ll have insight, but it’ll be insight delivered after the fact (i.e., not in real-time). To drive performance optimisations and assure the security of your network, you have two options: multiple monitors that show multiple dashboards at the same time, and try for a Minority-Report level of data analysis, or explore a solution that integrates with your existing tools to display all network monitoring data in a single dashboard.
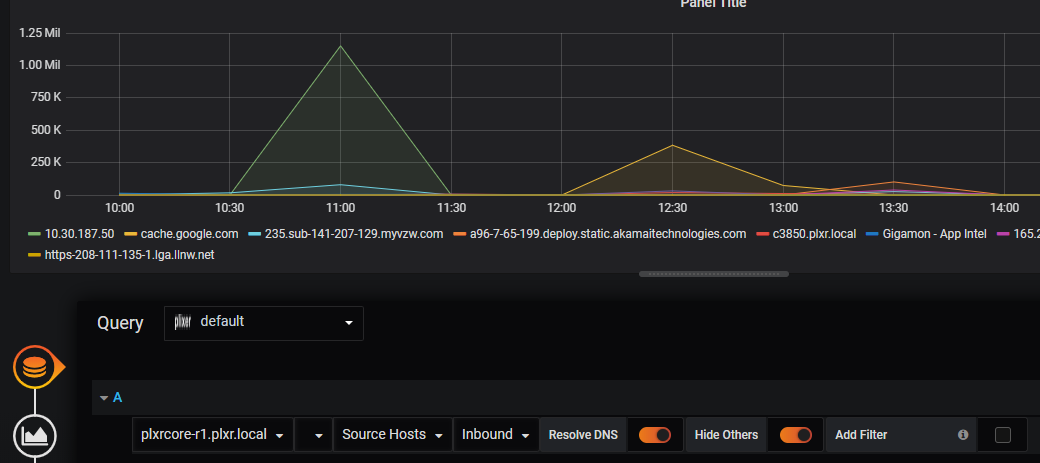
Naturally, as we’re not all mathematical geniuses, the latter is the preferred, and it’s now possible with Grafana. Grafana is an observability platform: an open-source analytics and monitoring solution that combines analytics through different tools – both Scrutinizer by Plixer and Statseeker integrate with Grafana – for a complete-picture overview. By combining Grafana’s capabilities with that of other tools, network managers are able to oversee network infrastructure, applications, and services in a single dashboard – including edge computing infrastructure.
Data-driven optimisation
Anything witnessed in real-time can be reacted to more quickly. For large networks – and, in 2020, every network will only increase in size and demand – the ability to identify unusual traffic, performance bottlenecks or attacks across an entire network is crucial. Networks are extending beyond on-premise infrastructure; with the advent of IoT and cloud infrastructure, supported through edge computing, networks are relied upon to facilitate organisational expansion, and network managers to ensure network security is maintained throughout.
The power of integration
Different tools have different strengths and weaknesses. Some provide better monitoring, whilst others will tell you more about the data trafficked. But time is a resource, and it traditionally takes time to leverage the benefits of each network security tool. By combining the strengths of different tools into a single dashboard – fed into a single vision of your network’s health – Grafana radically decreases the human resource of assuring network security, and better enables organisations to build out their network capabilities without incurring additional resource overhead.
Scrutinizer by Plixer is one of the industry’s most advanced network traffic analysis systems; Statseeker is an agnostic and predictive network monitoring solution. Combining the data from these two tools – in addition to the monitoring capabilities and data native to Grafana – means a more comprehensive overview of network health and security than any single tool could provide. It also means more information to inform and drive performance optimisations, faster incident detection, response and root-cause analysis, and greater insight into the past, present and future behaviours of network users.
Monitoring features of Grafana also include heatmaps and histograms – so you can have your network displayed in the most impactful way – a library of dashboard layouts to suit preference, the ability to define alerts and thresholds visually, and integrations with team collaboration tools such as Slack, so your entire team is alerted of an incident at the same time.
For more information about Grafana and how to best use it alongside other tool integrations, please contact us today.