Tell us what you want to achieve and we’ll get in touch…
Free delivery
Safe and secure checkout
Credit and debit card payments
In: Network Monitoring, SNMP Analysis, Statseeker
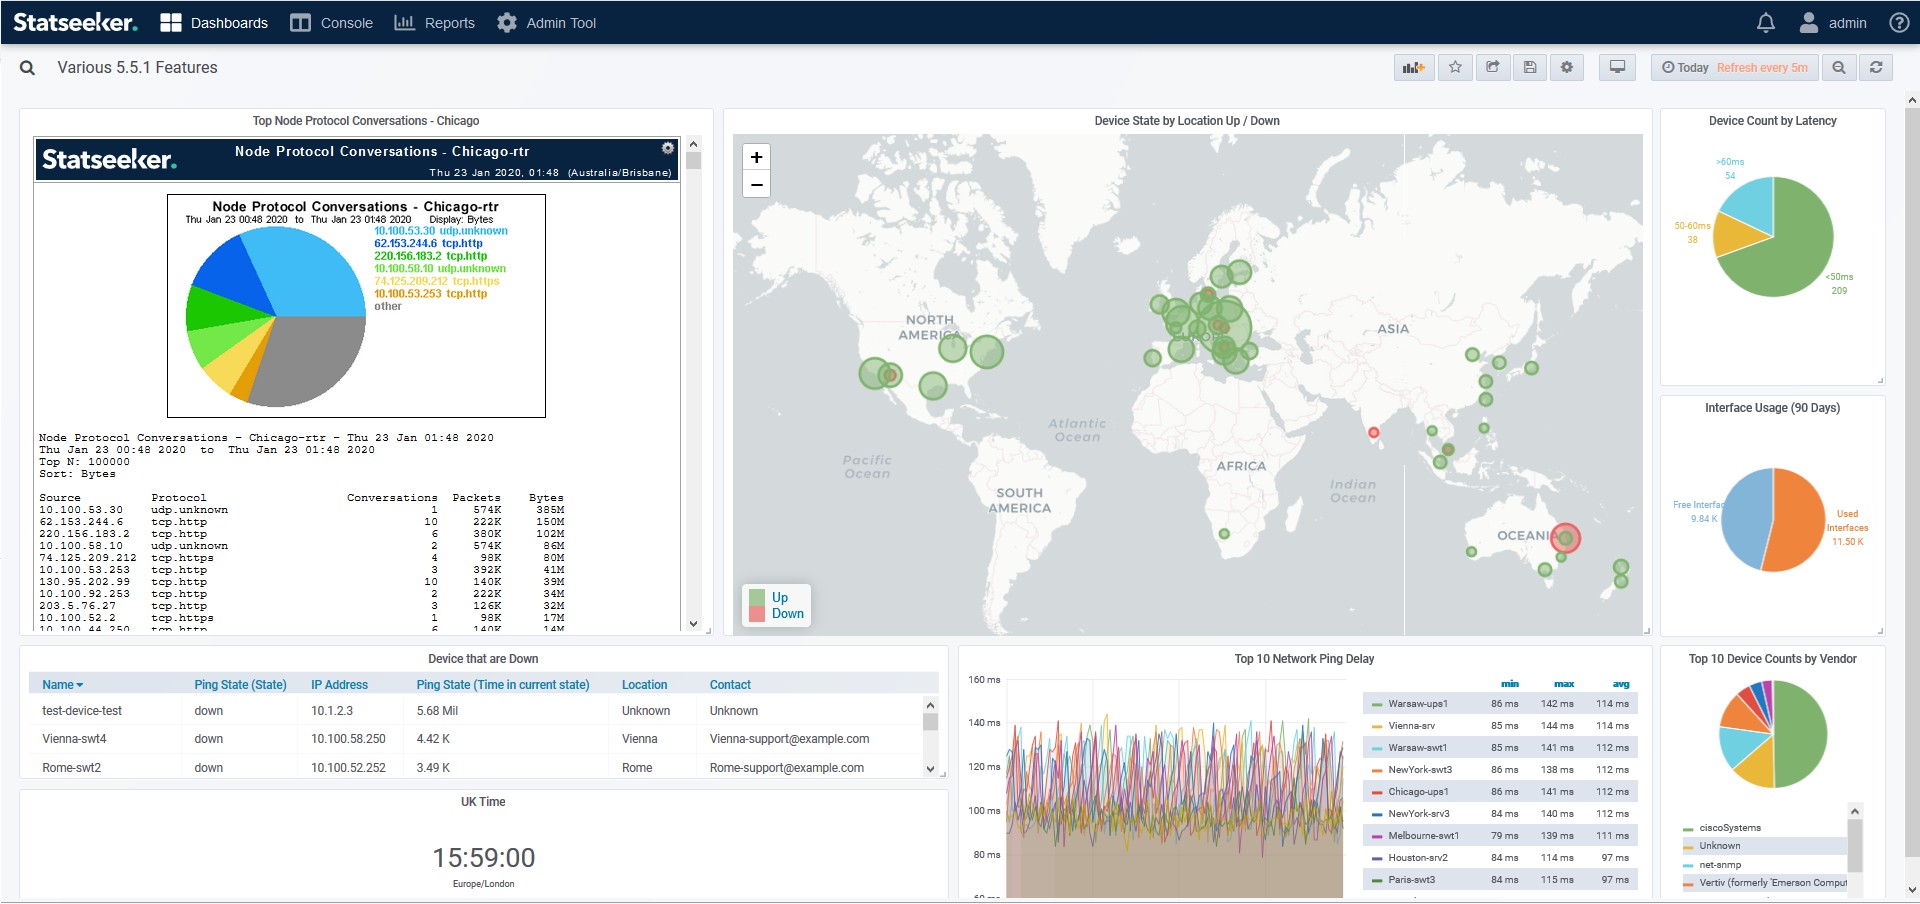
Statseeker SNMP Network Monitoring Software
Product code: Statseeker
Collects, stores and reports on SNMP data at high speed and with minimal system resources. Scaleable to cover the largest enterprises and government organisations with hundreds of thousands of ports/interfaces.
Provides in-depth visibility so you can see what is happening before it impacts users or customers, allowing you to save time and money in your operations.
Product Description
Installed on a single server as an appliance
Up and running within minutes
Low impact discovery method
Discovering a network of 600,000 interfaces in less than an hour
User based access control
User Authentication can be integrated to Active Directory
Providing total visibility across the entire network infrastructure
From a 64bit single server requiring no new equipment or additional pollers
Powerful monitoring
Statseeker specializes in SNMP data collection for the entire network, we also include Netflow and sFlow data
collection as part of the license, avoiding the purchase of an expensive Netflow data collector.
Monitors every device on the WAN and LAN
Polling interfaces every 60 seconds
Low bandwidth utilization
Minimal impact on your network
Monitors inventory information, collects Netflow, syslog, SNMP traps and UPS
1 Second diagnostic SNMP poller
Troubleshooting capacity for individual interfaces by on-demand 1 second interface polling for bps
Self maintains with automated rewalks
Dashboards & Viewers
Allows you to create a representation of the network that you want to see, whilst making it easy to identify trends
and hot spots on the network instantly.
Fast Reporting
Data is provided in real-time, reports which can be generated in seconds and customised to suit a group or individual.
Networking statistics including latency, bandwidth utilization, errors, discards, CPU, memory and temperature
MAC IP Switch data
New device support and updates
Netflow, Syslog and SNMP traps
SLA reporting
Network usage statistics
Threshold and advanced alerting options
Customizable reporting options with scheduling
Real-time, configurable dashboards per user
Customizable dashlets – easy to use and very practical
Graphics are clear, reports are immediate, alerts are instant, and there are threshold and advanced alerting options
Report examples: MAC IP Switch data, SLA Reporting and Top X Network Summary
Smart Data
Not only are you able to meet compliance and audit requirements, you can track trends, identify issues and make decisions
with 100% confidence in the integrity of your network information.
Gathers the data in 60 second intervals
Has advanced Auto Grouping
Data is never rolled up, aggregated or averaged
Data is saved indefinately in a purpose-built time series database, with no external database dependency.
Let's talk

Contact us Today
Copyright © 2024 Info Stor Limited. All rights reserved. E & OE. Registered in England and Wales Number 06621886
Registered Office: 6th Floor, 9 Appold Street, London EC2A 2AP, United Kingdom. VAT number: 934 4316 30. D-U-N-S® Number: 211273713.